How a Global Logistics Enterprise Improved Delivery Performance and SLA Compliance with a Real-Time Power BI Analytics Dashboard
Built a centralized delivery and SLA analytics dashboard that improved operational visibility and reduced manual reporting effort through real-time KPI monitoring.
Business Process Challenges
The Challenge
Delivery performance, employee productivity, and SLA compliance were tracked through manual reporting processes. Lack of real-time visibility made it difficult to monitor operational performance effectively. SLA breaches were often identified late, impacting service quality and customer satisfaction.
- Delayed deliveries could not be proactively tracked or addressed.
- Operational bottlenecks remained hidden due to fragmented data and reporting.
- Decision-makers lacked timely insights for quick and informed actions.
- Manual data consolidation increased reporting effort and reduced overall efficiency.
- The absence of centralized analytics limited performance optimization and continuous improvement.
Our Strategic Approach
Our Approach
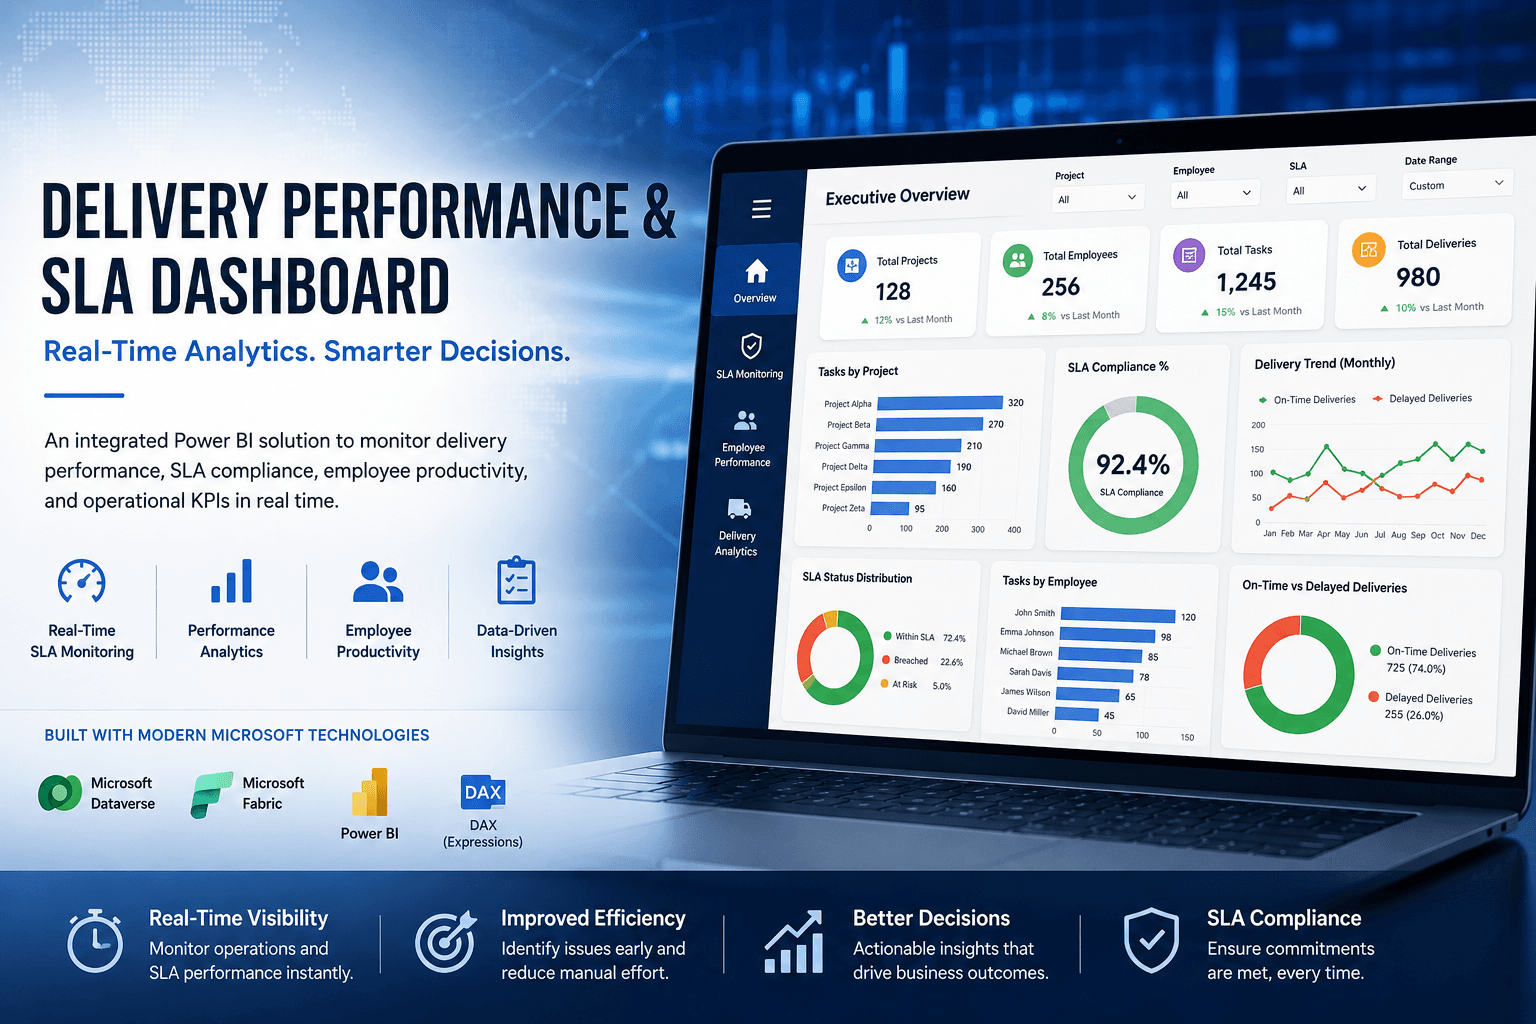
To address the challenges of manual reporting, limited operational visibility, and delayed SLA tracking, a centralized analytics solution was designed using Microsoft Dataverse, Microsoft Fabric, and Power BI. The approach began with consolidating delivery, employee, project, task, and SLA data into Dataverse, creating a structured and scalable data foundation. Microsoft Fabric was then used to integrate, prepare, and model the data for analytics consumption.
Power BI dashboards were developed to provide real-time insights into delivery performance, SLA compliance, employee productivity, and operational KPIs. Interactive filters, automated KPI calculations, and dynamic visualizations enabled stakeholders to monitor trends, identify bottlenecks, and make data-driven decisions. The solution delivered a single source of truth for operational reporting while reducing manual effort and improving overall visibility across the organization.
How we built the solution.
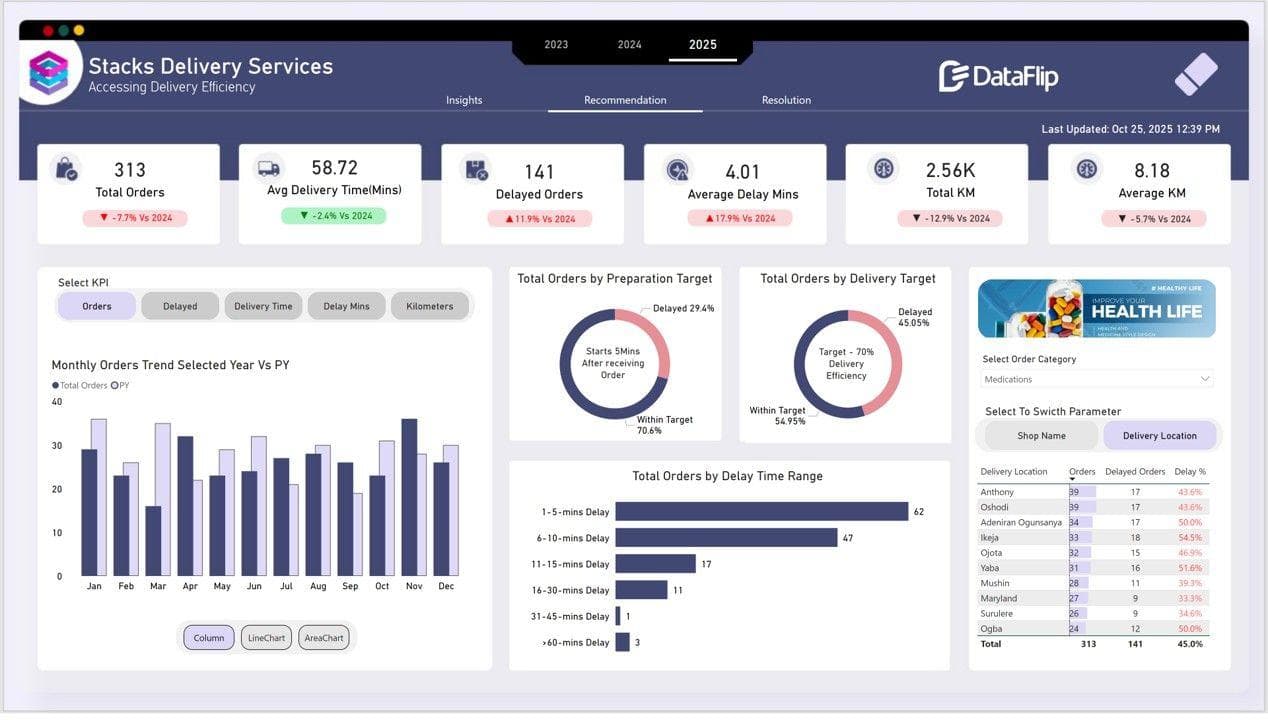
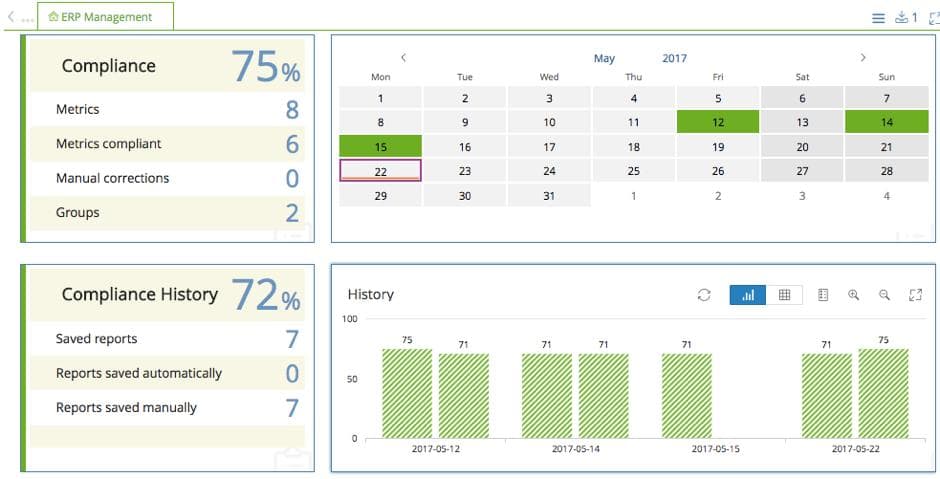
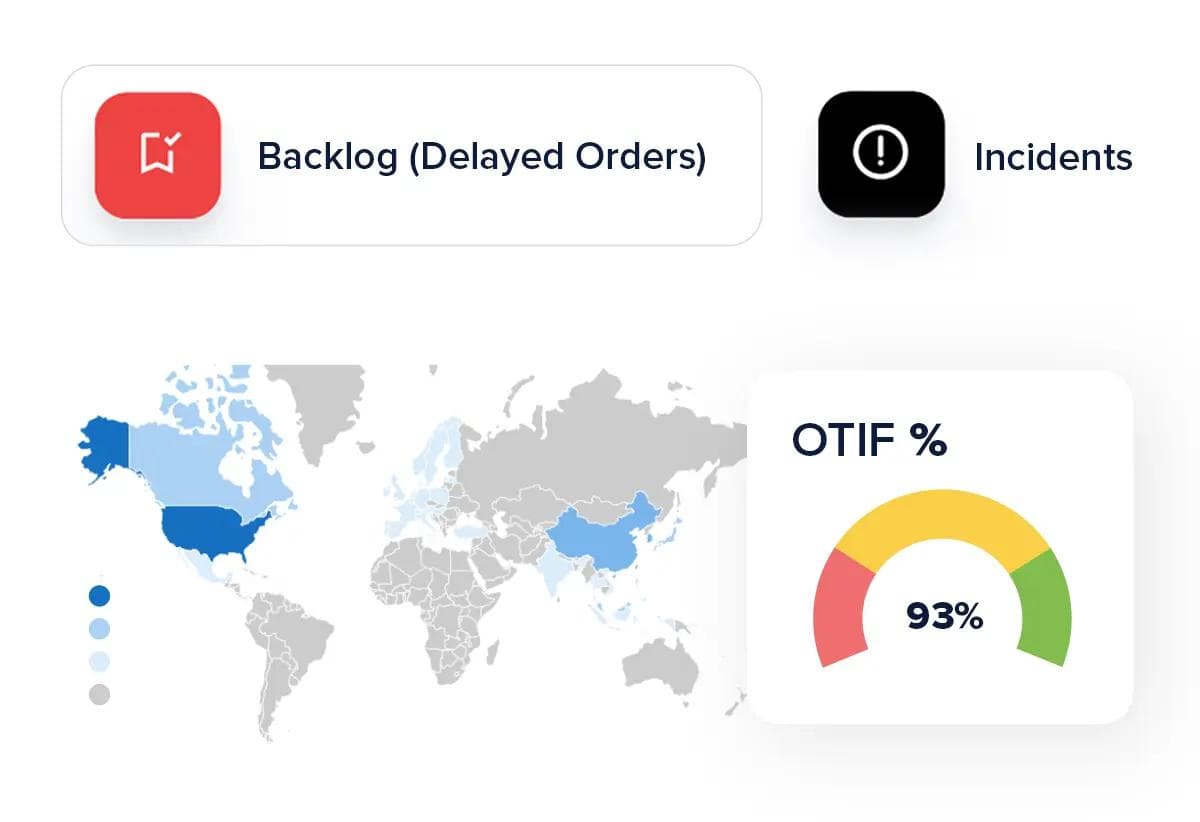
Explore the Solution Through visuals
Delivering Measurable Business Outcomes
The Outcome
• Enabled real-time monitoring of delivery operations and SLA compliance
• Automated operational reporting across multiple business units
• Improved visibility into delayed and on-time deliveries
• Centralized KPI reporting for executives and operations teams
• Enhanced employee productivity tracking and workload analysis
• Reduced manual effort associated with report generation and performance monitoring
The numbers behind the rollout.
The full integration layer.
Other engagements worth a look.
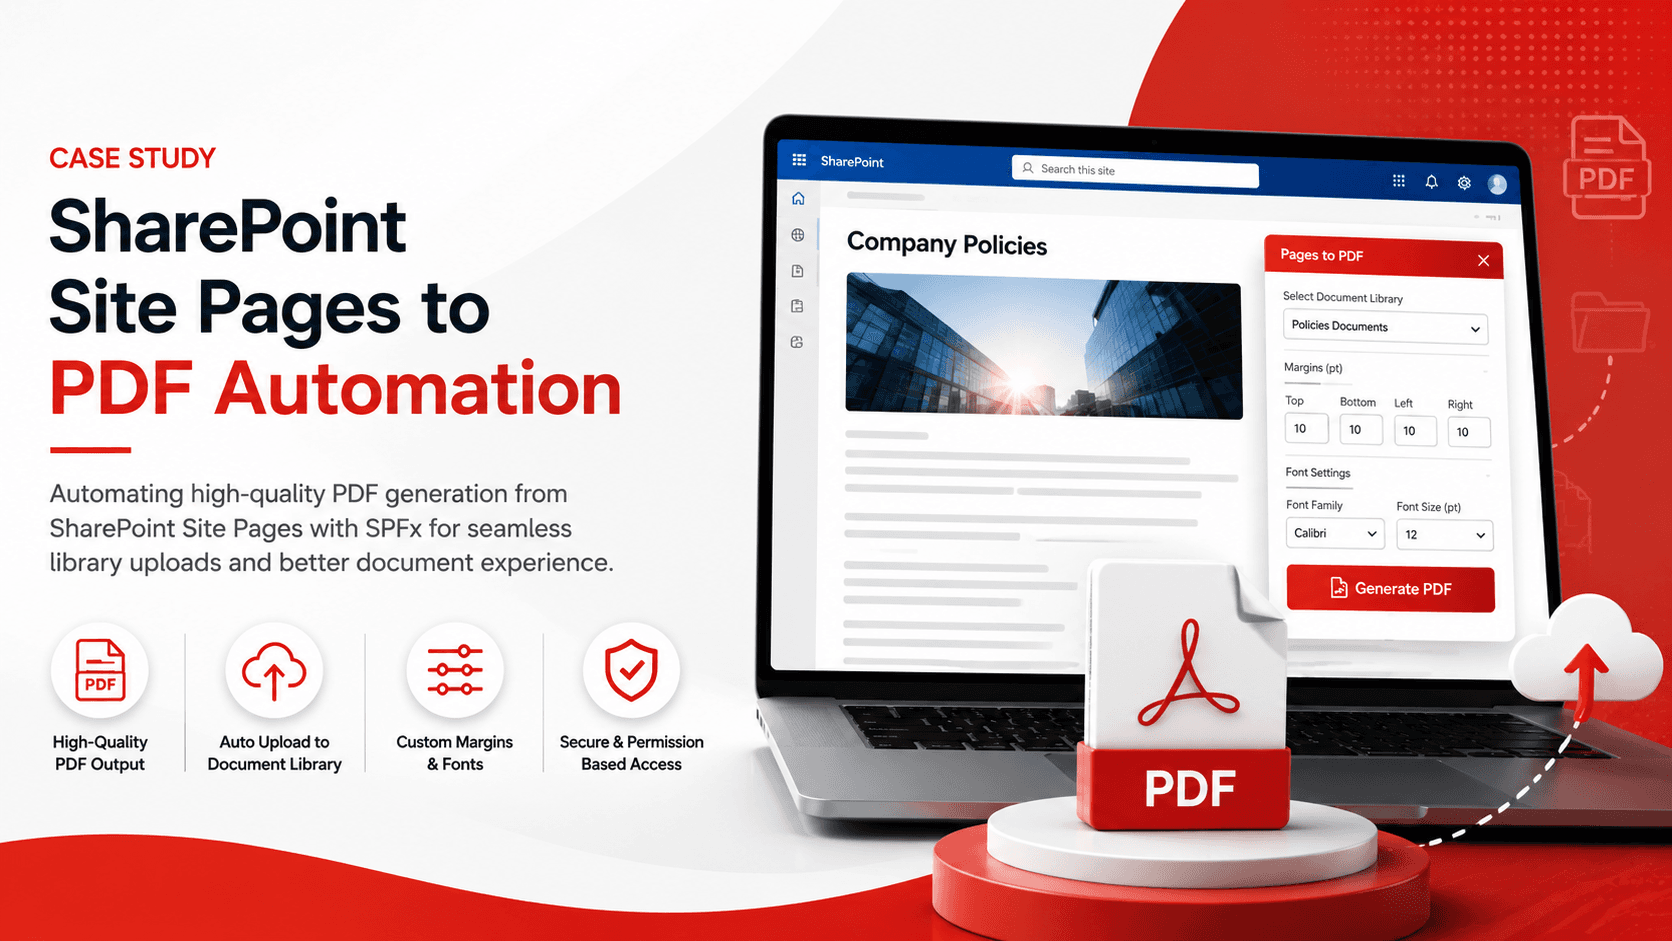
SharePoint Site Pages to PDF
Convert SharePoint Site Pages into high-quality PDFs with automated library uploads, improving document consistency and reducing manual effort.
Read case study →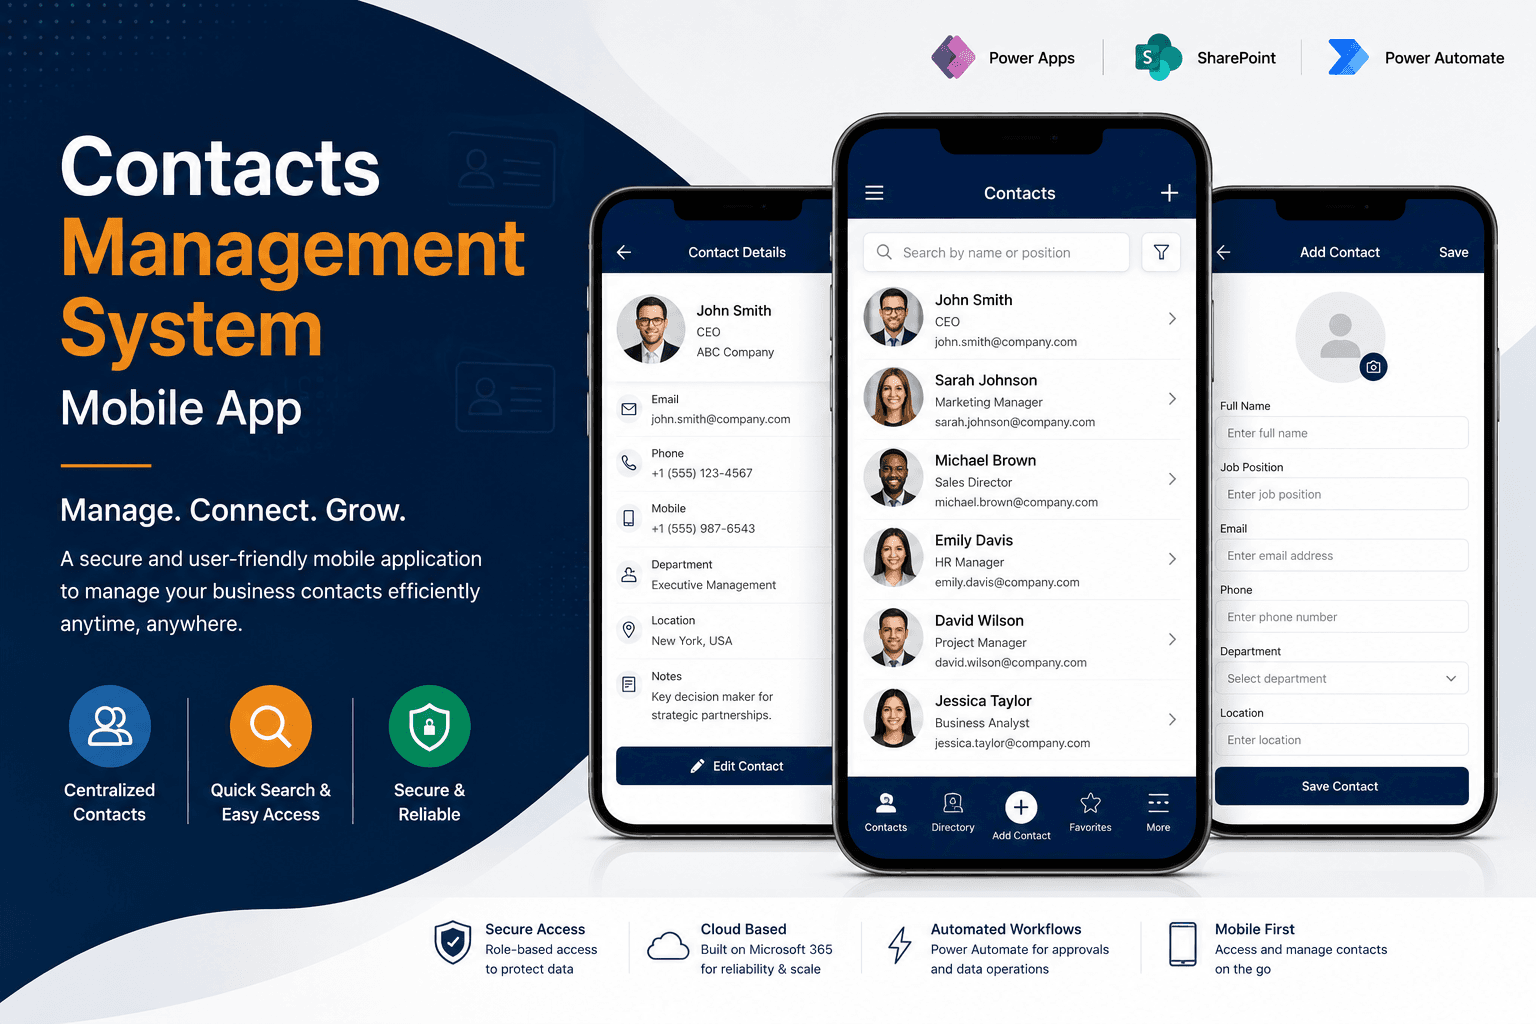
Modern Contacts Management System
Softree Technology developed a mobile Contacts Management System using Power Apps and SharePoint, enabling centralized contact management and faster access to business-critical information.
Read case study →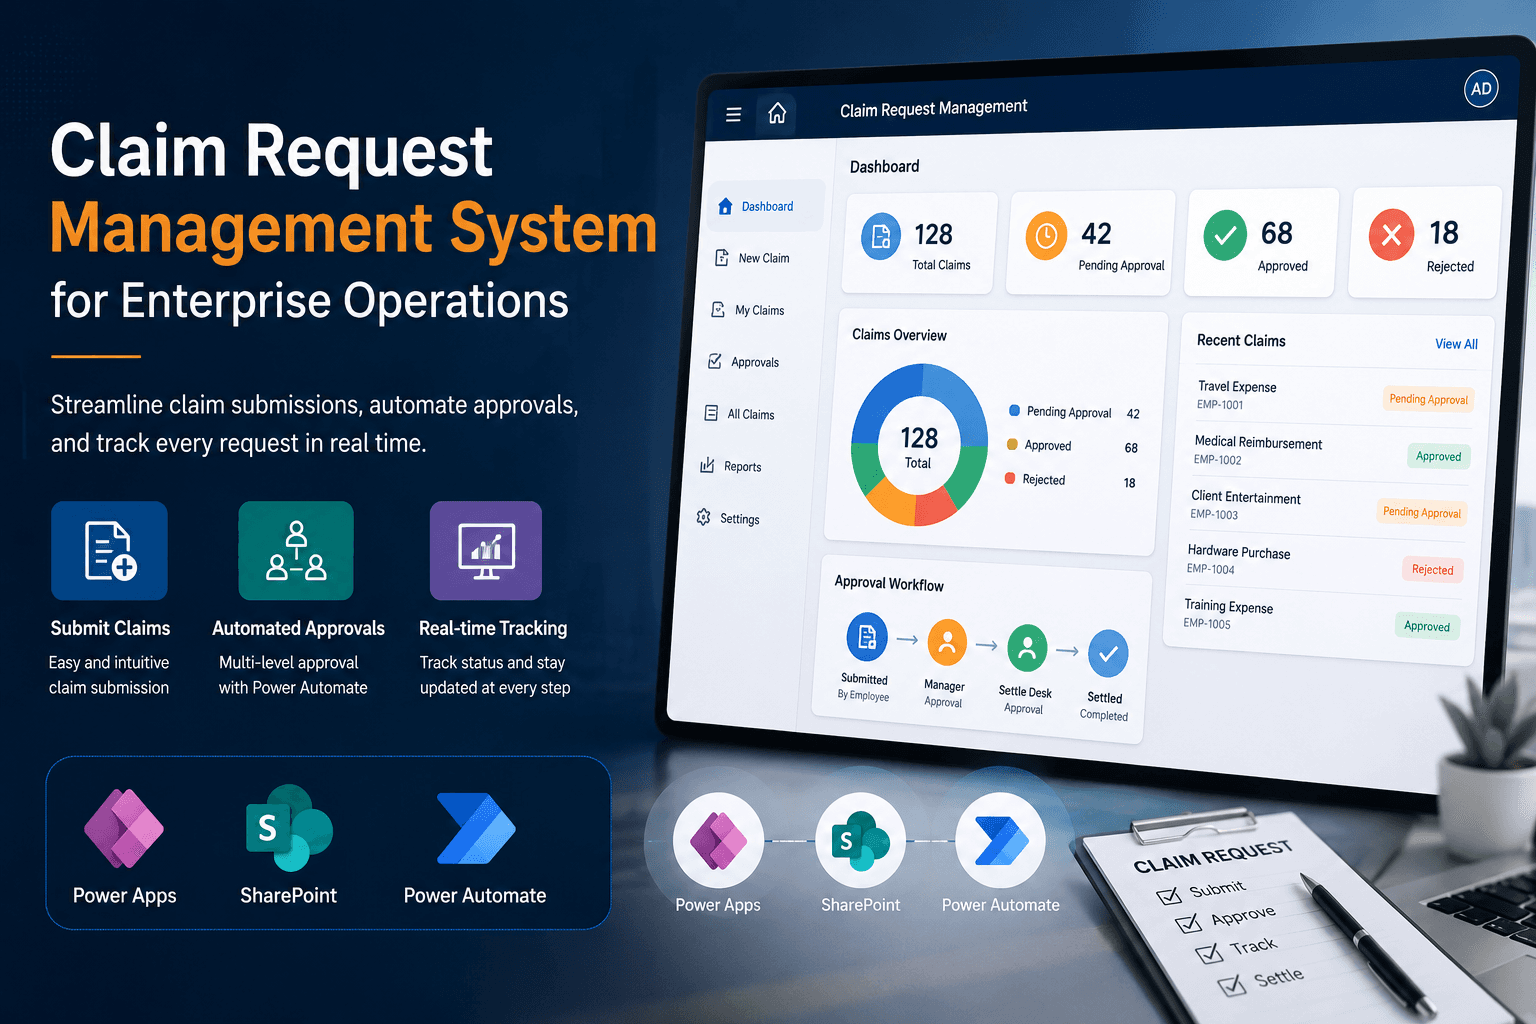
Claim Request Management System for Enterprise Operations
Softree Technology developed a Claim Request Management solution using Power Apps and SharePoint, reducing claim processing delays and improving approval tracking visibility across the organization.
Read case study →Frequently asked questions.
Build faster with a reliable offshore engineering partner.
Partner with Softree to accelerate product delivery, modernize enterprise systems, and scale with confidence.

What we offer
Offices
Bengaluru
11th Floor, Prestige Tech Park, Platina 2 · Outer Ring Rd, Kadubeesanahalli · Bengaluru, Karnataka 560087, India
Cuttack
PLOT 5C/1283, SECTOR-10, CDA · Cuttack, Odisha 753014 · India
San Francisco
San Francisco, CA 94108 · United States
Got a question, challenge, or idea?
Fill out the form or pick a time on our scheduler.
30-min discovery call
Same Calendly as our booking page · instant invite