Introduction
Enterprise organizations generate enormous amounts of data across ERP systems, CRM platforms, finance applications, supply chain systems, websites, operational databases, cloud applications, IoT devices, and external sources. Yet having access to large volumes of data does not necessarily mean an organization can use that data effectively.
The real challenge is turning fragmented business data into trusted information that can support better decisions. When data is spread across disconnected systems, spreadsheets, and reporting environments, teams often spend more time finding, preparing, and reconciling information than actually analyzing it.
Enterprise data analytics helps organizations move beyond fragmented reporting by connecting data, analytical models, visualization, and decision-making into a structured capability. Instead of simply understanding what happened in the past, organizations can use analytics to understand what is happening now, identify why it is happening, forecast what may happen next, and determine what action should follow.
Quick Answer
Enterprise data analytics is the process of bringing business data together, transforming it into trusted information, analyzing it in context, and using the resulting insights to improve business decisions and outcomes.
A strong analytics strategy goes beyond creating dashboards. It connects data with specific business decisions, helping organizations improve forecasting, operational efficiency, customer experience, revenue, cost management, inventory, and service performance while maintaining appropriate governance and security.
Table of Contents
- What Is Enterprise Data Analytics?
- Why Is Enterprise Data Analytics Important?
- Common Enterprise Data Challenges
- From Data to Action
- Enterprise Data Analytics Strategy
- Benefits and ROI
- Enterprise Use Cases
- Enterprise Analytics Architecture
- Best Practices
- Implementation Approach
- How Enterprise Data Analytics Supports AI Readiness
- Common Mistakes to Avoid
- Key Takeaways
- Conclusion
What Is Enterprise Data Analytics?
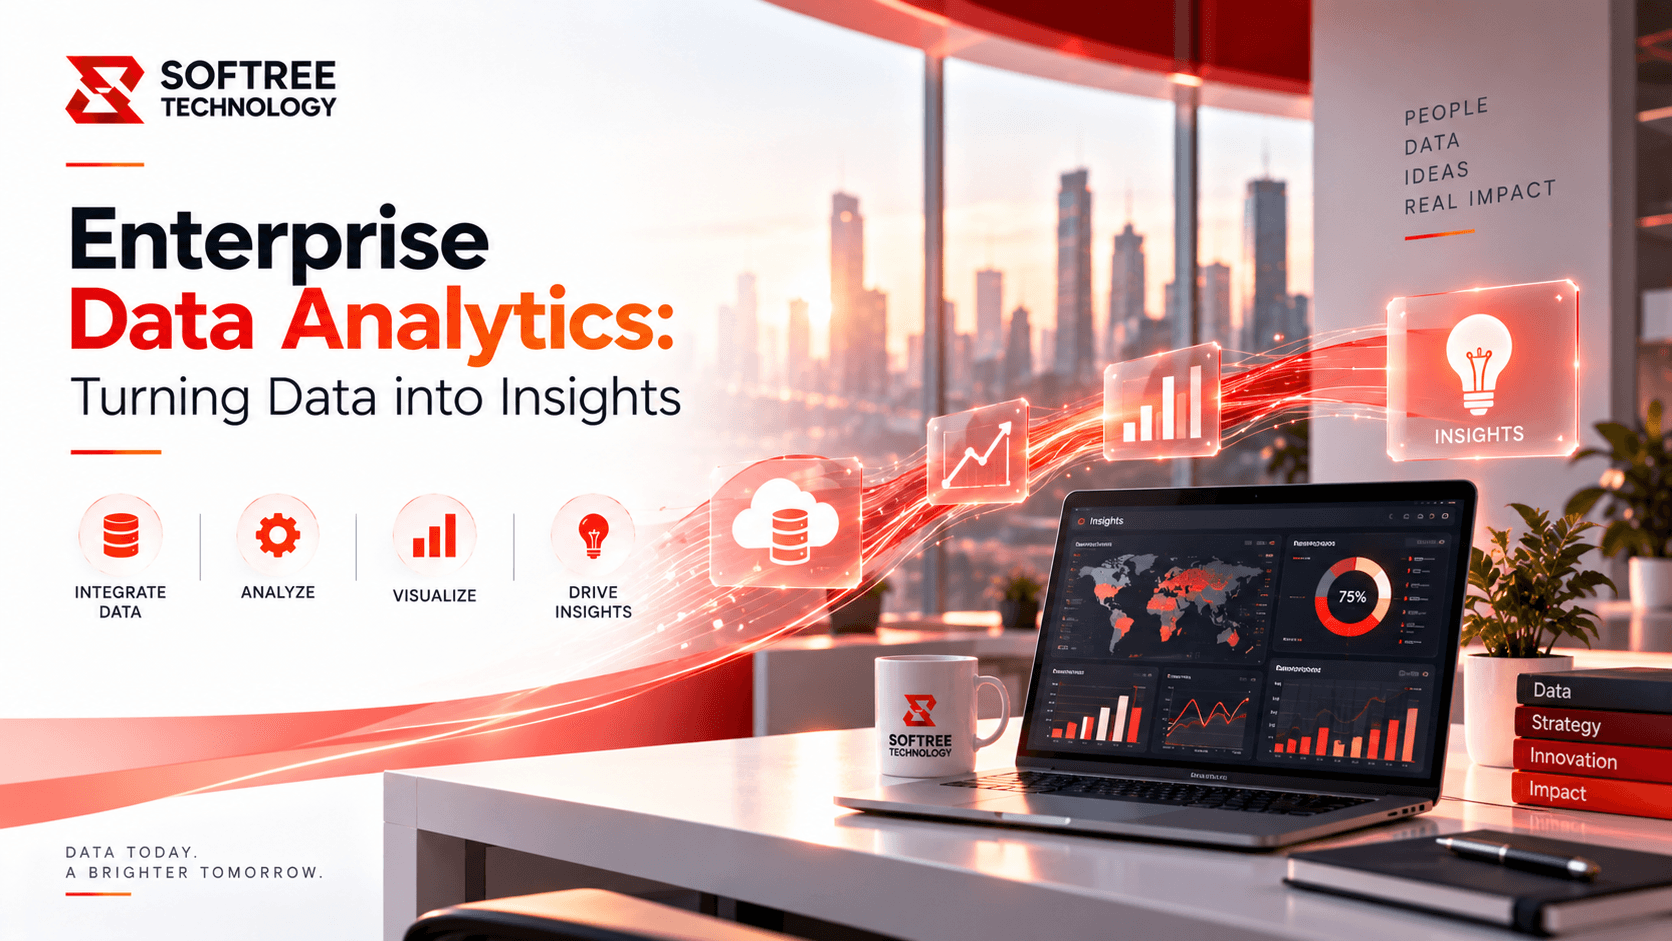
Enterprise data analytics is the structured use of data, analytical techniques, and business intelligence across an organization to understand performance and support better decisions. It typically brings together information from ERP, CRM, finance, operations, marketing, supply chain, websites, applications, and external sources.
The objective is not simply to collect more data or produce more reports. A mature analytics capability creates a clear path from source data to business action. Data is collected and governed, transformed into reliable information, analyzed in business context, presented through meaningful metrics, and connected to decisions and operational workflows.
This allows analytics to become an ongoing business capability rather than a collection of disconnected dashboards and reporting projects.
Why Is Enterprise Data Analytics Important?
Many organizations have already invested heavily in applications, databases, cloud platforms, and data storage, but still struggle to answer basic business questions quickly. The problem is often not a lack of information but fragmentation, inconsistent definitions, poor data quality, limited context, and slow movement from information to action.
Different departments may calculate the same KPI differently, creating competing versions of business performance. Analysts may need to consolidate spreadsheets manually, while business users may depend on technical teams whenever reports need to be changed.
Traditional reports can also explain what happened without providing enough context about why it happened or what should happen next. Enterprise data analytics addresses this gap by connecting descriptive reporting with diagnostic, predictive, and prescriptive analysis.
From Data to Action
A successful enterprise analytics environment begins with data from operational systems, applications, files, APIs, devices, and external sources. The data needs to be integrated so that relationships between customers, products, transactions, locations, assets, and other business entities can be understood.
The next stage is preparing the information through cleansing, validation, standardization, enrichment, and transformation. This creates a more reliable foundation for analytical models and business metrics.
Once the data is prepared, organizations can create semantic models and reusable metrics that represent business concepts in a consistent way. Analytics can then be applied to understand historical performance, identify causes, predict future outcomes, and recommend potential actions.
The final step is connecting insights with action. Dashboards, reports, alerts, and scorecards can help users understand important changes, but the real value comes when those insights influence decisions, workflows, operational improvements, or strategic initiatives. Results can then be measured and fed back into the analytics cycle.
Enterprise Data Analytics Strategy
Start With Business Decisions
A successful analytics strategy should begin with the decisions the organization wants to improve rather than with dashboards or technology selection. These decisions could involve pricing, demand planning, inventory allocation, workforce planning, customer retention, cash management, production scheduling, or logistics optimization.
Starting with the business problem makes it easier to determine what data is actually required, which analytical methods are appropriate, and how success should be measured.
Establish a Trusted Data Foundation
Organizations need a governed architecture that connects relevant data sources while maintaining appropriate ownership and security. Critical data should be traceable from its original source through transformation and analytical outputs.
This foundation helps teams understand where information comes from and whether it can be trusted for important business decisions.
Create a Consistent Semantic Layer
A semantic layer translates technical data into business concepts that users can understand. Important metrics such as revenue, gross margin, customer churn, order cycle time, inventory turnover, and on-time delivery should have clearly agreed definitions and calculation rules.
This prevents different departments from producing conflicting versions of the same KPI and creates a consistent foundation for enterprise reporting.
Combine Different Levels of Analytics
Enterprise analytics can move progressively from descriptive to more advanced forms of analysis. Descriptive analytics helps organizations understand what happened through KPIs, dashboards, and historical trends.
Diagnostic analytics focuses on why something happened through root-cause analysis, drill-downs, and variance analysis. Predictive analytics looks at what is likely to happen using forecasts, risk scores, and demand predictions.
Prescriptive analytics goes one step further by helping organizations determine what action should be taken through recommendations, prioritization, and optimized actions.
Design Analytics for Action
Analytics becomes significantly more valuable when users know what to do with the information they receive. Dashboards should highlight meaningful exceptions, provide context, and direct users toward the action or workflow that can address the issue.
Role-based views and alerts can also help different teams focus on the information that matters most to their responsibilities.
Benefits and ROI
Faster Decision-Making
Enterprise analytics can reduce the time required to find, reconcile, and interpret business information. Instead of waiting for manually prepared reports, decision-makers can access more timely and connected information.
Better Forecasting
Historical patterns combined with current business signals can help organizations improve planning and forecasting. This can be particularly valuable for demand planning, financial forecasting, inventory management, and workforce planning.
Improved Operational Efficiency
Analytics can reveal bottlenecks, waste, exceptions, and underperforming processes. By identifying the areas that require attention, organizations can prioritize improvement initiatives based on evidence.
Revenue Improvement
Connected customer, product, channel, and pricing data can reveal opportunities for revenue growth. Sales and marketing teams can use analytics to identify customer behavior, pipeline trends, cross-sell opportunities, and channel performance.
Better Customer Experience
Combining customer behavior, service information, and operational data can help organizations identify friction points across the customer journey and prioritize improvements.
Stronger Accountability
Consistent KPIs provide teams with a shared understanding of performance. Clear ownership of metrics also makes it easier to track whether specific business areas are improving.
Scalable Self-Service Analytics
A governed analytics environment can allow business users to explore trusted information without requiring a new report to be developed for every question.
Measuring the ROI of Enterprise Analytics
The value of enterprise analytics should be measured through business outcomes rather than simply counting dashboards, reports, or data volumes.
Organizations can evaluate benefits such as reduced reporting time, lower operational costs, increased sales, improved retention, reduced inventory, fewer service failures, or faster business processes.
For example, if analytics reduces hundreds of hours of manual reporting each year while also helping reduce operational costs or improve customer conversion, those outcomes can be translated into financial value. This provides a more meaningful business case than measuring success based only on how many dashboards were delivered.
Enterprise Use Cases
Finance and Performance Management
Finance teams can connect financial, operational, and commercial information to create a unified view of revenue, margins, expenses, cash flow, budgets, and business-unit performance. Analytics can help identify important variances earlier and provide greater visibility into the factors driving financial performance.
Sales and Customer Analytics
Organizations can combine CRM activity, transactions, customer behavior, product usage, and service information to understand pipeline health, customer value, churn risk, cross-sell opportunities, and sales performance.
Supply Chain and Logistics
Analytics can connect orders, inventory, warehouses, routes, carriers, delivery events, and costs to improve demand planning, inventory availability, transportation performance, and exception management.
Manufacturing and Operations
Manufacturers can bring production, quality, maintenance, machine, labor, and inventory information together to identify downtime drivers, production bottlenecks, quality problems, and capacity constraints.
Healthcare and Life Sciences
Governed analytics can help healthcare and life sciences organizations understand operational, financial, service, and resource data while maintaining appropriate privacy, security, and compliance controls.
Human Resources
Workforce analytics can provide insight into employee capacity, hiring pipelines, retention patterns, skills, absenteeism, and workforce costs. These insights can support workforce planning and resource allocation.
Marketing Analytics
Marketing teams can connect campaign activity, web engagement, customer data, and sales outcomes to understand acquisition efficiency, channel performance, customer journeys, and marketing ROI.
Enterprise Analytics Architecture
A modern enterprise analytics environment typically consists of several connected layers. The process begins with data sources such as ERP, CRM, finance systems, applications, databases, files, APIs, IoT platforms, and external sources.
An ingestion and integration layer then moves and combines this data through batch or near-real-time pipelines. Storage and data engineering environments provide a scalable foundation for raw, curated, and analytical data while applying transformation and quality controls.
Above this foundation sits the semantic and analytics layer, where organizations establish business definitions, metrics, analytical models, and reusable logic. Visualization and consumption tools then provide dashboards, reports, scorecards, alerts, embedded analytics, and self-service exploration.
The architecture should also connect analytics with operationalization. Insights can trigger workflows, notifications, planning processes, applications, and operational decisions. Governance and security should operate across the entire environment through identity management, access control, data quality, cataloging, lineage, compliance, monitoring, and lifecycle management.
Best Practices
Organizations should align analytics initiatives with strategic business priorities and select use cases based on business value, feasibility, decision frequency, and stakeholder support.
KPIs should be clearly defined before dashboards are created. Each important metric should have an agreed definition, owner, calculation method, source system, and reporting context.
Data quality should also be treated as an ongoing capability rather than a one-time cleanup activity. Organizations should continuously monitor completeness, accuracy, consistency, timeliness, and validity.
Reusable semantic models and common business definitions can support multiple analytical experiences while reducing duplication. At the same time, dashboards should be designed according to the needs of different users. Executives, managers, analysts, and frontline employees often require different levels of detail and different actions.
Governance should enable self-service rather than prevent it. Security, lineage, ownership, and certification should increase trust while allowing business users to work with approved data.
Finally, analytics programs should measure adoption and business outcomes. The objective is not simply to deliver reports but to determine whether users act on insights and whether the intended business metrics improve.
Implementation Approach
Discover
The implementation should begin by identifying strategic decisions, stakeholders, existing reports, data sources, business pain points, KPI definitions, and measurable outcomes.
Prioritize
Potential use cases can then be evaluated based on business value, data readiness, complexity, urgency, and expected adoption. A focused first release can help demonstrate value without attempting to transform the entire organization at once.
Design
The target architecture, data model, security framework, governance approach, integration patterns, KPI definitions, and user experience can then be established.
Build
The development stage brings these components together through data ingestion, transformation, quality checks, semantic models, dashboards, alerts, and supporting workflows.
Validate
Before launch, organizations should validate data accuracy, KPI calculations, performance, security, usability, and reconciliation against trusted source systems.
Launch and Adopt
User training, ownership, monitoring, and feedback are important for successful adoption. Analytics should evolve based on how people actually use the information.
Scale
Once successful patterns and reusable models have been established, organizations can expand analytics across additional departments, geographies, data domains, and advanced use cases.
How Enterprise Data Analytics Supports AI Readiness
A reliable enterprise analytics foundation also creates an important foundation for AI and advanced analytics. Predictive models, AI assistants, automated decision support, and intelligent workflows depend on data that is accessible, well-defined, secure, and trustworthy.
Organizations do not necessarily need to introduce AI into every analytics initiative immediately. A more practical approach is to establish reliable data and consistent business definitions first, then identify specific decisions or workflows where machine learning or generative AI can provide measurable value.
Strong analytics practices can make future AI initiatives easier to govern, integrate, and measure because the underlying data and business context are already established.
Common Mistakes to Avoid
Organizations should avoid starting with technology selection before clearly defining the business problem. Building dashboards without resolving KPI definitions and data ownership can also create more confusion rather than better visibility.
Data quality should not be treated as a one-time cleansing project. Similarly, creating department-specific analytics environments can reproduce the same fragmentation that the enterprise analytics initiative was intended to solve.
Organizations should also avoid unrestricted self-service access. Users need flexibility, but that flexibility should operate within appropriate governance and security controls.
Finally, success should not be measured by the number of reports delivered. The more meaningful question is whether analytics is improving decisions and producing measurable business outcomes. Incremental delivery is often more effective than attempting a large transformation without learning from real users.
Key Takeaways
Enterprise data analytics is more than a dashboarding or reporting initiative. It is a business capability that connects trusted data with decisions and measurable outcomes.
The strongest analytics programs establish consistent KPIs, improve data quality, provide useful business context, and move beyond describing what happened toward understanding causes, anticipating outcomes, and guiding action.
A phased implementation can help organizations demonstrate value early while building reusable analytics capabilities that can scale across departments and business functions.
A reliable enterprise analytics foundation can also support future AI and advanced analytics initiatives by providing secure, governed, and well-defined data.
Conclusion
Enterprise Data Analytics can help organizations transform fragmented business data into trusted, actionable insights that support better decision-making, forecasting, operational efficiency, customer experience, and business performance. By connecting data sources, governance, analytical models, visualization, and business workflows, organizations can move beyond traditional reporting and create a more connected view of the business.
The goal is not simply to build more dashboards or collect more data. It is to create an analytics capability that connects reliable information with meaningful business decisions, measurable outcomes, and continuous improvement. A well-governed and scalable foundation can also prepare organizations for advanced analytics and future AI initiatives.
If your organization is looking to modernize enterprise analytics, connect fragmented data, build trusted business intelligence, or create an AI-ready data foundation, Softree Technology can help design and implement data and analytics solutions aligned with your business and technology requirements.