Quick Answer
Real-time analytics means analyzing continuously changing or frequently refreshed data quickly enough to support decisions about current business conditions. The required latency depends on the business use case and may range from seconds to minutes rather than always requiring sub-second processing.
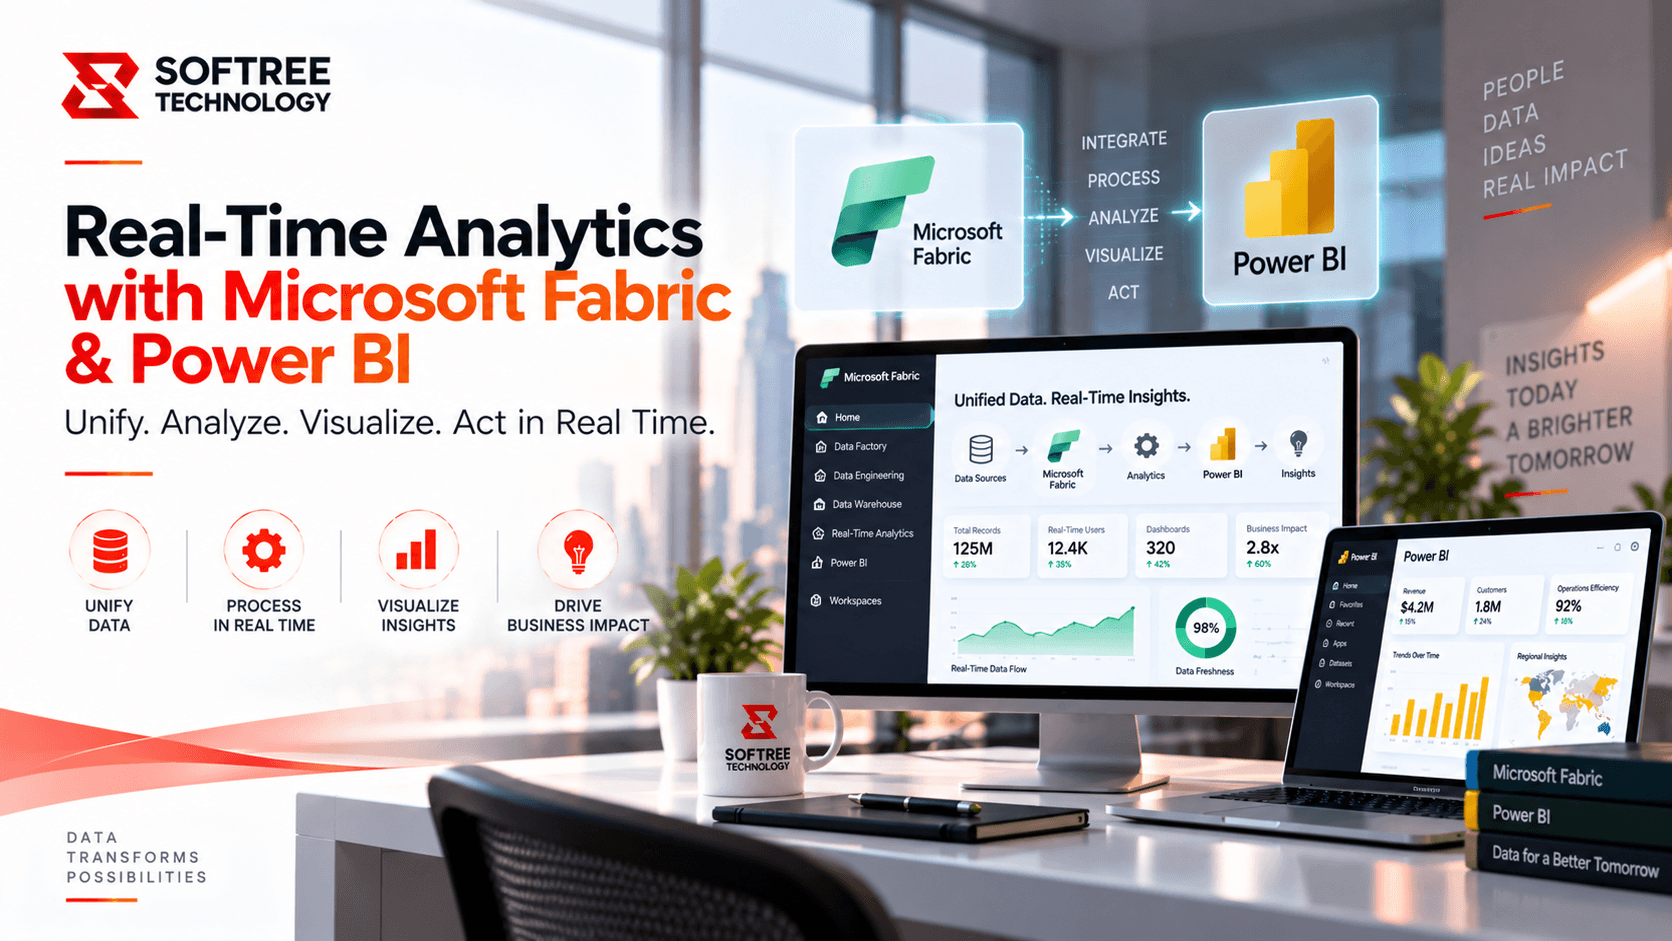
Microsoft Fabric brings together data ingestion, engineering, storage, analytics, governance, and business intelligence. Power BI adds semantic models, reports, dashboards, and visualization capabilities. When these technologies are designed together, organizations can combine current operational data with historical context to understand what is happening, why it is happening, and what action may be required.
What Is Real-Time Analytics?
Real-time analytics analyzes incoming or frequently refreshed data quickly enough for users to act while the underlying business condition is still relevant. The meaning of "real time" varies by organization. A supply chain team may need shipment updates within minutes, while another operational process may require information within seconds.
For this reason, organizations should begin by defining the required freshness and decision window instead of assuming that every workload needs sub-second processing. The right architecture should match the speed at which the business needs to respond.
Why Enterprises Need Real-Time Analytics
Many enterprises already have large volumes of operational data, but important decisions can still depend on delayed information. Databases, SaaS applications, devices, APIs, operational systems, logs, and files may be continuously updated while traditional reporting processes operate on scheduled refreshes.
This creates a gap between what is happening in the business and what decision-makers can see. Teams may discover operational problems after an opportunity to intervene has passed, while analysts spend time preparing extracts, reconciling figures, and producing reports. Data can also remain distributed across multiple applications and departmental systems, making it difficult to establish a consistent view of business performance.
Real-time analytics addresses these challenges by bringing changing operational data into an architecture where it can be processed, governed, modeled, visualized, and connected to business actions. This can help organizations identify exceptions earlier, improve operational visibility, and reduce the delay between an event and an informed response.
How Microsoft Fabric Supports Real-Time Analytics
Microsoft Fabric provides an integrated environment for data engineering, analytics, data warehousing, and business intelligence. Its capabilities can support different stages of a real-time analytics architecture, from data ingestion and processing through storage, modeling, governance, and analysis.
Organizations can use components such as OneLake, Data Factory, Real-Time Intelligence capabilities, notebooks, warehouses, and semantic models according to their workload requirements. This integrated approach helps reduce fragmentation between different data and analytics activities while providing a foundation for building governed enterprise analytics.
The architecture can support multiple ingestion patterns. Streaming, event-based, incremental, and micro-batch approaches can be combined depending on the source, data volume, reliability requirements, and required latency. This flexibility allows organizations to design real-time capabilities around actual business requirements rather than forcing every data source into the same processing model.
The Role of Power BI in Real-Time Analytics
Power BI provides the business-facing experience for consuming analytical information. Semantic models establish consistent definitions for measures, relationships, dimensions, and business metrics, while reports and dashboards allow users to monitor current performance and investigate changes.
A governed semantic layer is particularly important in enterprise environments. Without consistent KPI definitions, different departments may calculate or interpret the same metric differently. Power BI semantic models can help centralize these definitions and provide a common analytical foundation across business teams.
Real-time dashboards should also be designed around decisions rather than simply displaying continuously changing information. A useful dashboard should help users understand what changed, where it changed, how significant the change is, and whether action is required.
Building a Real-Time Analytics Architecture
A successful real-time analytics strategy should cover the complete flow of information, from capturing operational events through processing, storage, modeling, visualization, and action.
Capture and Ingest Data
The first step is identifying the operational sources that generate relevant information. These may include SQL databases, applications, APIs, IoT devices, event streams, files, and other business systems.
The ingestion approach should be selected based on data volume, source capabilities, reliability, and latency requirements. Some sources may require streaming, while others can use incremental or micro-batch ingestion.
Unify Data in Microsoft Fabric
Once data is captured, Microsoft Fabric can provide a unified environment for managing and analyzing it. OneLake, Data Factory, Real-Time Intelligence capabilities, warehouses, notebooks, and semantic models can be used according to the specific workload.
The objective is not simply to collect more data. It is to establish a governed foundation where operational and historical information can work together.
Prepare and Govern the Data
Data quality is critical for real-time analytics. Organizations should apply transformations, validation, enrichment, deduplication, and business logic before information reaches business-facing dashboards.
Raw, refined, and curated data should be logically separated where appropriate. Standardizing timestamps, business keys, dimensions, and KPI definitions can also make real-time workloads easier to maintain and govern.
Create a Governed Semantic Layer
The semantic layer connects technical data structures with business meaning. Power BI semantic models can establish consistent measures, relationships, dimensions, and analytical definitions.
This reduces duplicated KPI logic and helps different departments work from the same definition of business performance. It also creates a reusable foundation for dashboards, reports, and analytical applications.
Deliver Live Insights
Power BI dashboards and reports can surface current metrics, trends, operational status, and exceptions. The experience should focus on the information users need to make decisions.
For example, an operations team may need to see current workload, service-level indicators, inventory conditions, or delayed activities rather than a large collection of unrelated charts.
Connect Insights to Action
Real-time analytics becomes more valuable when insights can lead to an operational response. Alerts, workflows, automated processes, applications, and human escalation can be connected to defined business thresholds.
This turns analytics from a passive reporting layer into an active part of the decision process.
Benefits of Real-Time Analytics
The value of real-time analytics should be measured by the decisions and business outcomes it improves rather than by refresh speed alone. Organizations can evaluate benefits through measures such as decision latency, detection-to-resolution time, KPI coverage, analyst hours saved, utilization, cost per unit, and metric consistency.
Faster access to operational information can reduce the time between an event and an informed response. Earlier issue detection can help teams identify exceptions before they develop into larger incidents. Shared operational visibility can give teams a common understanding of current performance, while automation can reduce recurring spreadsheet consolidation and manual reporting.
Real-time analytics can also support better resource utilization by helping organizations respond to changing demand. At the same time, governed data models and access controls can strengthen consistency, security, and accountability across enterprise reporting.
Real-Time Analytics vs. Traditional Business Intelligence
Traditional business intelligence remains valuable for historical analysis, periodic reporting, and understanding long-term trends. Real-time and near-real-time analytics address a different requirement: helping users respond to conditions that are changing now.
Traditional BI often relies on scheduled refreshes and batch-oriented pipelines, with response windows measured in hours or days. Real-time analytics can use streaming, event-based, and batch patterns together, with response windows measured in seconds, minutes, or another business-defined interval.
The two approaches do not need to compete. In many enterprise environments, the strongest architecture combines current operational information with historical data. Current data explains what is happening, while historical context helps users determine whether a change is normal, unusual, improving, or deteriorating.
Enterprise Use Cases
Supply Chain and Logistics
Real-time analytics can help organizations monitor shipment status, delivery exceptions, fleet activity, warehouse throughput, inventory levels, and transportation costs. Operations teams can use live information to prioritize delayed shipments, identify bottlenecks, and respond to changing demand.
Healthcare Operations
Healthcare organizations can monitor emergency department activity, bed utilization, appointment volumes, claims workflows, turnaround times, and operational capacity. Combining current activity with historical benchmarks can help teams recognize unusual patterns and make more informed resource allocation decisions.
Financial Services
Financial organizations can monitor transactions, payment activity, service operations, liquidity indicators, and potential anomalies. Current information supports rapid investigation, while governed historical data provides context for trends and exceptions.
Retail and E-Commerce
Retailers can track orders, inventory, product demand, fulfillment status, customer activity, and store performance. Real-time visibility can help teams respond to stockouts, demand spikes, fulfillment delays, and changing sales patterns.
Manufacturing
Manufacturing organizations can combine equipment signals, production events, quality information, and maintenance data to monitor production lines. Current operating conditions can be compared with historical performance to identify deviations and prioritize maintenance or process intervention.
Customer Experience and Service Operations
Customer service teams can monitor contact-center queues, service-level indicators, case volumes, response times, and backlog. Current operational data can help supervisors rebalance workloads before service targets are missed.
Best Practices for Real-Time Analytics
A successful implementation starts by defining business latency. The term "real time" should translate into a measurable freshness target based on the decision being supported. A requirement for five-minute updates can require a very different architecture from a sub-second requirement.
Organizations should also design dashboards around decisions. Instead of adding streaming visuals simply because data can stream, every dashboard should answer a specific business question and provide the information required to act.
Combining current and historical context is another important practice. Current data shows what is happening, while historical information provides the context needed to understand whether a change represents a normal pattern or an emerging issue.
Security and governance should be built into the architecture from the beginning. Identity controls, role-based access, row-level security, data classification, and governance policies help protect enterprise information while ensuring that users receive the appropriate level of access.
Organizations should also plan for scale and failure. Event volumes, peak loads, late-arriving data, duplicates, connectivity failures, retries, and recovery procedures can all affect the reliability of a real-time analytics platform.
How to Implement Real-Time Analytics
A practical implementation can begin with an assessment of existing data sources, BI assets, business processes, reporting latency, stakeholders, and operational pain points. From there, organizations can prioritize use cases according to business value, decision urgency, data readiness, complexity, and measurable ROI.
The next stage is defining the target architecture, including ingestion, storage, processing, semantic modeling, visualization, governance, and integration patterns. Rather than attempting to transform every reporting workload at once, organizations can start with one high-value workflow and establish measurable baseline and target KPIs.
Once the proof of value is established, the solution can be industrialized with appropriate security, data quality, monitoring, performance optimization, documentation, deployment practices, and operational support. Additional departments and use cases can then be added using reusable data products, semantic models, patterns, and governance controls.
Measuring ROI
Real-time analytics should have measurable business objectives. Useful measures include reporting hours saved, reduced operational losses, improved service levels, faster exception resolution, reduced inventory or capacity waste, and increased productivity.
The strongest business cases connect every real-time analytics use case to a specific decision and a measurable operational or financial outcome. This ensures that investments in data infrastructure and analytics are evaluated based on business value rather than technology adoption alone.
Conclusion
Real-Time Analytics with Microsoft Fabric and Power BI helps enterprises move beyond delayed reporting toward continuously informed decision-making. The value comes from more than simply refreshing dashboards faster; it comes from connecting current and historical data, governed KPIs, secure access, analytics, and business action.
Microsoft Fabric provides the integrated data and analytics foundation, while Power BI provides the visualization and business intelligence experience needed to turn data into useful insights. With the right architecture and governance, organizations can improve operational visibility, detect issues earlier, and respond more effectively to changing business conditions.
Softree Technology helps organizations modernize enterprise analytics through Microsoft Fabric, Power BI, data engineering, governed analytics, and real-time reporting solutions. The focus is on building practical analytics architectures that connect data with the decisions that matter most.