Introduction
Power BI and Tableau are two widely used business intelligence platforms that help organizations transform data into meaningful insights and support data-driven decision-making. For enterprises, selecting the right BI platform involves more than comparing dashboards or visualization capabilities. Organizations must consider their existing technology ecosystem, data architecture, analytics requirements, governance model, scalability, security, AI capabilities, and long-term costs.
Quick Answer
There is no universal winner between Power BI and Tableau. Power BI is often a strong choice for Microsoft-first enterprises that prioritize integration with Microsoft 365, Azure, Fabric, governed semantic models, and broad business adoption. Tableau can be a strong fit for organizations that prioritize advanced visual exploration, analytical storytelling, or already have a mature Tableau environment. The right choice ultimately depends on the organization's business requirements, technology ecosystem, analytics maturity, and long-term data strategy.
Business Problem: Why Enterprises Need a Structured BI Decision
Large organizations often operate with fragmented reporting environments that include spreadsheets, legacy BI tools, departmental dashboards, data warehouses, cloud applications, and operational systems. This can result in duplicated dashboards, inconsistent KPI definitions, manual reporting, limited self-service analytics, and increasing governance and security challenges.
Selecting a BI platform should therefore be part of the broader enterprise analytics strategy. Organizations should first define their business outcomes, understand their existing data architecture, establish governance requirements, and then evaluate Power BI and Tableau against measurable business, data, user, governance, AI, and financial criteria.
Power BI vs Tableau: Feature Comparison
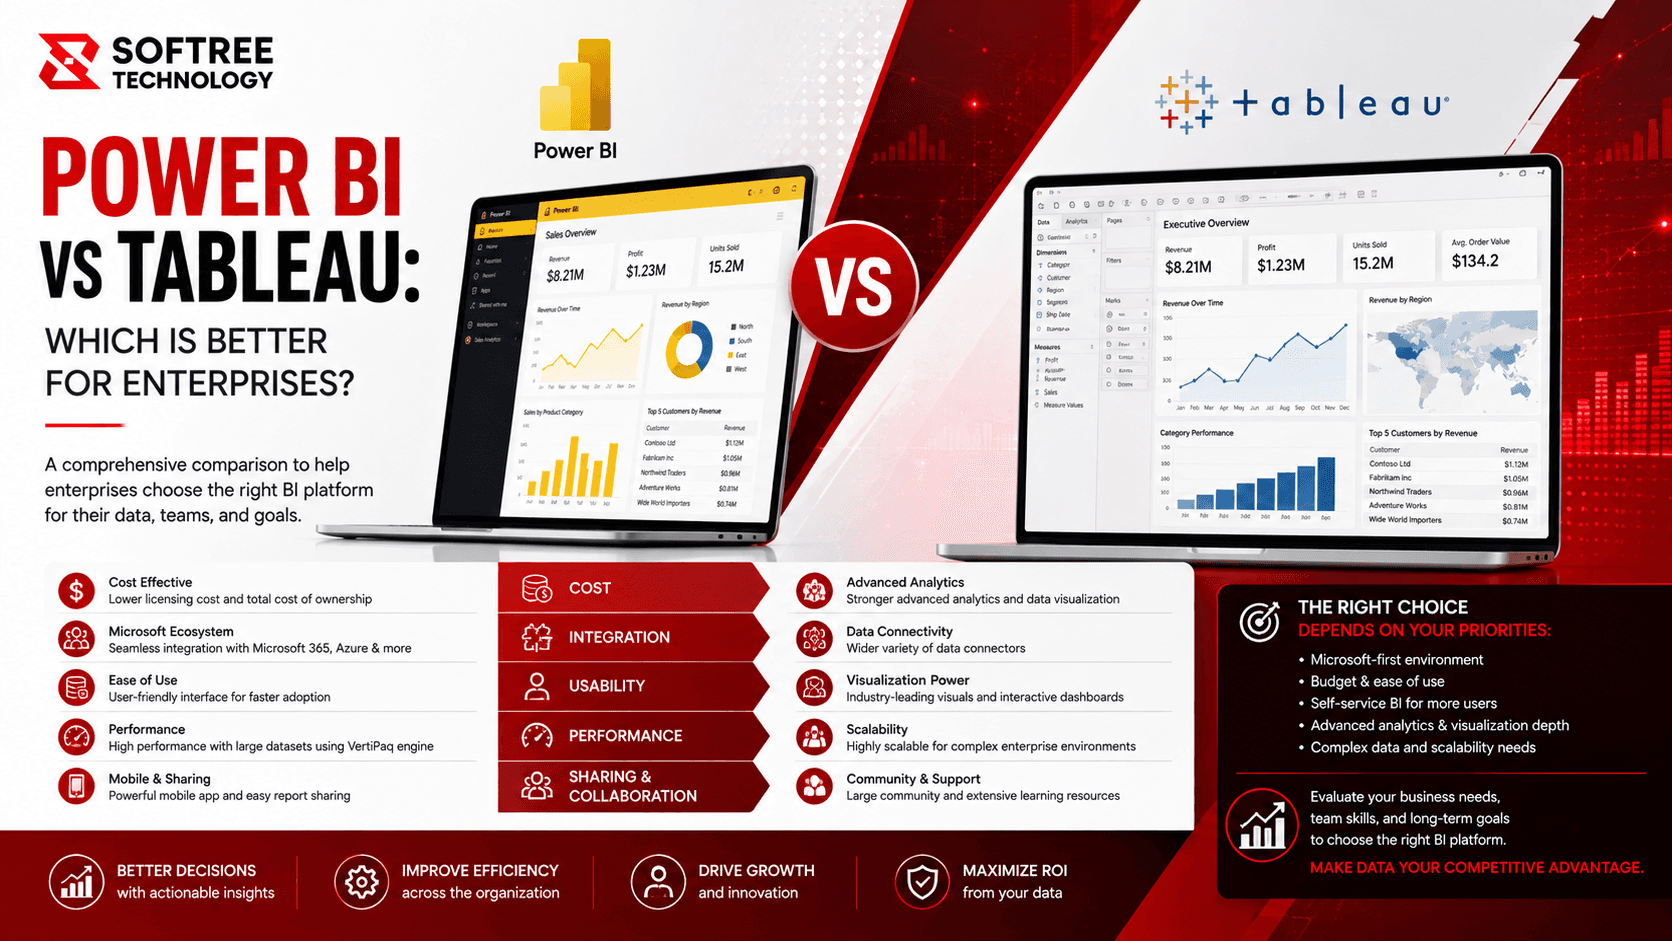
Power BI and Tableau both provide enterprise business intelligence capabilities, but they have different areas of strength. Power BI is particularly well suited to enterprise BI and Microsoft-integrated analytics, while Tableau is widely recognized for visual analytics and exploration. Both platforms support broad data connectivity, self-service analytics, governance, cloud deployment, and evolving AI capabilities.
Power BI can be particularly attractive for organizations already using Microsoft Fabric, Azure, SQL Server, Excel, and other Microsoft cloud services. Tableau provides broad connectivity across databases, files, cloud applications, warehouses, and enterprise systems. The best choice is generally the platform that fits the organization's target architecture with the least unnecessary complexity.
Data Modeling and Semantic Consistency
Consistent business definitions are critical for enterprise analytics. A governed semantic layer allows organizations to reuse business logic instead of recreating calculations across individual reports. Power BI semantic models can be particularly relevant for organizations building governed analytics and AI experiences, while Tableau also provides reusable and governed data assets and analytics workflows.
Visualization and Analytical Exploration
Tableau has a strong focus on visual analytics, interactive exploration, and analytical storytelling, making it valuable for analysts who need to investigate patterns and create highly visual experiences. Power BI provides interactive dashboards, reports, drill-through experiences, and a broad visual ecosystem, while its integration with Microsoft productivity tools can make analytics easier to consume within existing workflows.
Rather than relying only on general rankings, enterprises should evaluate both platforms using the same business questions and representative scenarios.
AI-Powered Analytics
AI is becoming an increasingly important part of enterprise BI. Power BI includes Copilot capabilities that can support report creation, summaries, natural-language interaction, DAX-related tasks, and semantic-model work. Tableau is also expanding its AI capabilities through Tableau Agent, Tableau Pulse, and its broader agentic analytics direction.
Organizations should evaluate these capabilities using practical business scenarios, including natural-language questions, automated insights, AI-assisted dashboard development, calculation accuracy, security, permissions, administration, and governance.
Enterprise Governance, Security, and Scalability
Enterprise BI requires strong governance to prevent fragmented reporting and inconsistent business information. Organizations should establish clear ownership for data, semantic models, reports, and dashboards while defining standards for certified content, access policies, deployment processes, and lifecycle management.
Security should be evaluated using real organizational roles, including identity integration, row-level access, sharing controls, external access, auditing, data residency, and administration. Both Power BI and Tableau can support enterprise-scale workloads, but actual scalability depends on architecture, workload design, data volumes, concurrent users, refresh requirements, performance, and operating models.
Benefits and ROI
The value of an enterprise BI platform comes from improving decision-making while reducing reporting friction. A successful BI program can reduce manual reporting, improve KPI consistency, increase self-service adoption, accelerate identification of operational issues, and provide a stronger foundation for AI-enabled analytics.
Organizations should measure ROI using practical metrics such as reporting hours saved, duplicate reports retired, self-service adoption, certified KPI usage, decision speed, data-quality improvements, and measurable business outcomes such as forecast accuracy, utilization, revenue, margin, or service-level improvements.
Enterprise Use Cases
Power BI and Tableau can support a wide range of enterprise scenarios. Finance teams can use BI for revenue, margin, forecasting, cost, and cash-flow analysis. Sales teams can analyze pipelines, bookings, win rates, territories, customer segments, and forecasts. Supply chain teams can monitor procurement, inventory, logistics, production, and service performance. Other applications include healthcare analytics, marketing performance, and executive KPI reporting.
Best Practices
Enterprises should define business outcomes before comparing product features and use a structured evaluation framework covering architecture, modeling, visualization, governance, security, AI, adoption, scalability, and cost. Both platforms should be tested with the same representative datasets and business questions.
The evaluation should involve executives, business users, analysts, developers, data engineers, security teams, and administrators. Organizations should also test governance and deployment processes, calculate three- to five-year total cost of ownership, establish common KPI standards, and treat AI as an extension of a governed data architecture.
Implementation Approach
A successful implementation can begin with discovery and assessment, where organizations inventory existing reports, users, data sources, licenses, workloads, KPIs, and security requirements. The next phase is architecture and proof of concept, where comparable Power BI and Tableau solutions can be tested for performance, governance, usability, security, and AI capabilities.
The pilot phase should focus on one or two high-value business domains and measure adoption, performance, development effort, and user satisfaction. After validation, organizations can move toward enterprise rollout by establishing governance, reusable data and reporting standards, and user training.
Power BI vs Tableau: Which Should Enterprises Choose?
The decision should be based on the organization's priorities rather than a universal product ranking. Power BI deserves strong consideration when the organization follows a Microsoft-first architecture, needs governed semantic analytics, or wants close alignment with Microsoft AI and productivity workflows. Tableau may be the better direction when advanced visual exploration is a priority or when the organization already has significant Tableau investment, skills, and operating processes.
Organizations may also choose a coexistence strategy when different business requirements justify using both platforms. In every case, the decision should consider business fit, architecture, governance, security, adoption, scalability, AI requirements, and total cost.
Conclusion
Power BI and Tableau are both capable enterprise BI platforms, but the right choice depends on the organization's technology ecosystem, business requirements, analytics maturity, governance needs, and long-term strategy. Power BI can be particularly valuable for Microsoft-first organizations seeking integrated analytics, governed semantic models, and Microsoft ecosystem alignment, while Tableau can provide strong value for organizations focused on visual exploration or already operating a mature Tableau environment.
The best approach is to evaluate both platforms using real enterprise data, business scenarios, user requirements, security controls, governance processes, AI use cases, scalability requirements, and total cost of ownership. Rather than selecting a platform based only on dashboard appearance or licensing price, enterprises should choose the solution that provides sustainable business value and fits their broader analytics strategy. Softree can help organizations assess their BI requirements, compare Power BI and Tableau, run proof-of-concept evaluations, modernize reporting environments, and build a practical enterprise analytics roadmap.
If your organization is evaluating Power BI vs. Tableau or planning to build an enterprise analytics solution, Softree can help you select, design, and implement the right BI solution based on your business requirements.
https://www.softreetechnology.com/